
We've rolled out a set of updates to the Reports Dashboard designed to make reporting more powerful, flexible, and easier to share. These improvements help teams move from high-level insights to detailed analysis and coaching, while making collaboration around reports faster and more seamless.
With enhanced reporting capabilities and newly added shareable links, reports are now easier to configure, explore, and distribute—without rebuilding views or exporting files. Below is a detailed overview of what's new and how these updates improve your reporting workflow.
Smart Filtering & Date Ranges
Reports begin with flexible filtering that allows you to define exactly what data you're analyzing. Selecting a campaign sets the scope of the report, ensuring the data is relevant and consistent. Date ranges can be adjusted based on your goal, whether you're reviewing weekly coaching trends or analyzing performance over a longer period of time. This makes every report more intentional and easier to interpret.
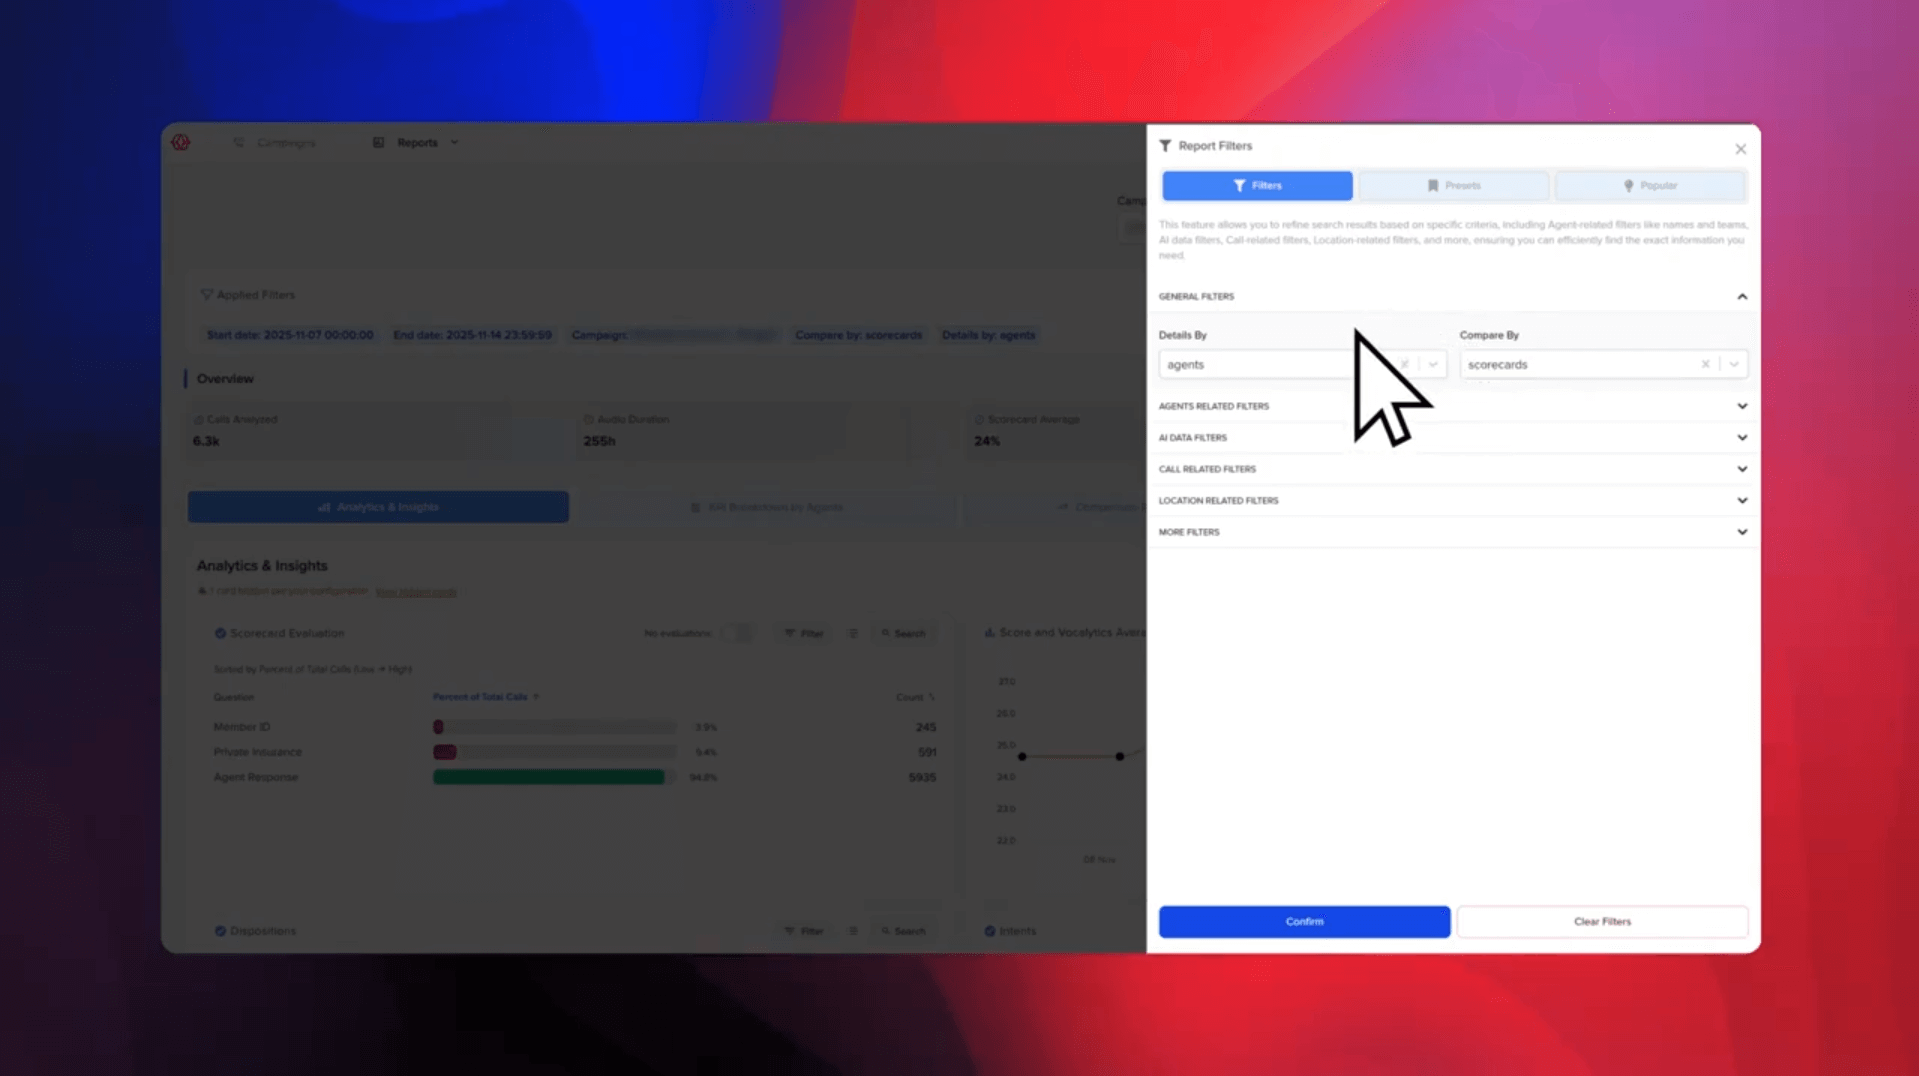
Flexible Grouping with Details By
The Reports Dashboard allows you to group results using Details By, making it easy to analyze performance by agent, team, or affiliates and buyers. This grouping applies consistently across all report views, allowing you to compare performance across different parts of the organization without rebuilding reports. Switching groupings helps surface patterns and outliers quickly while maintaining the same underlying data set.
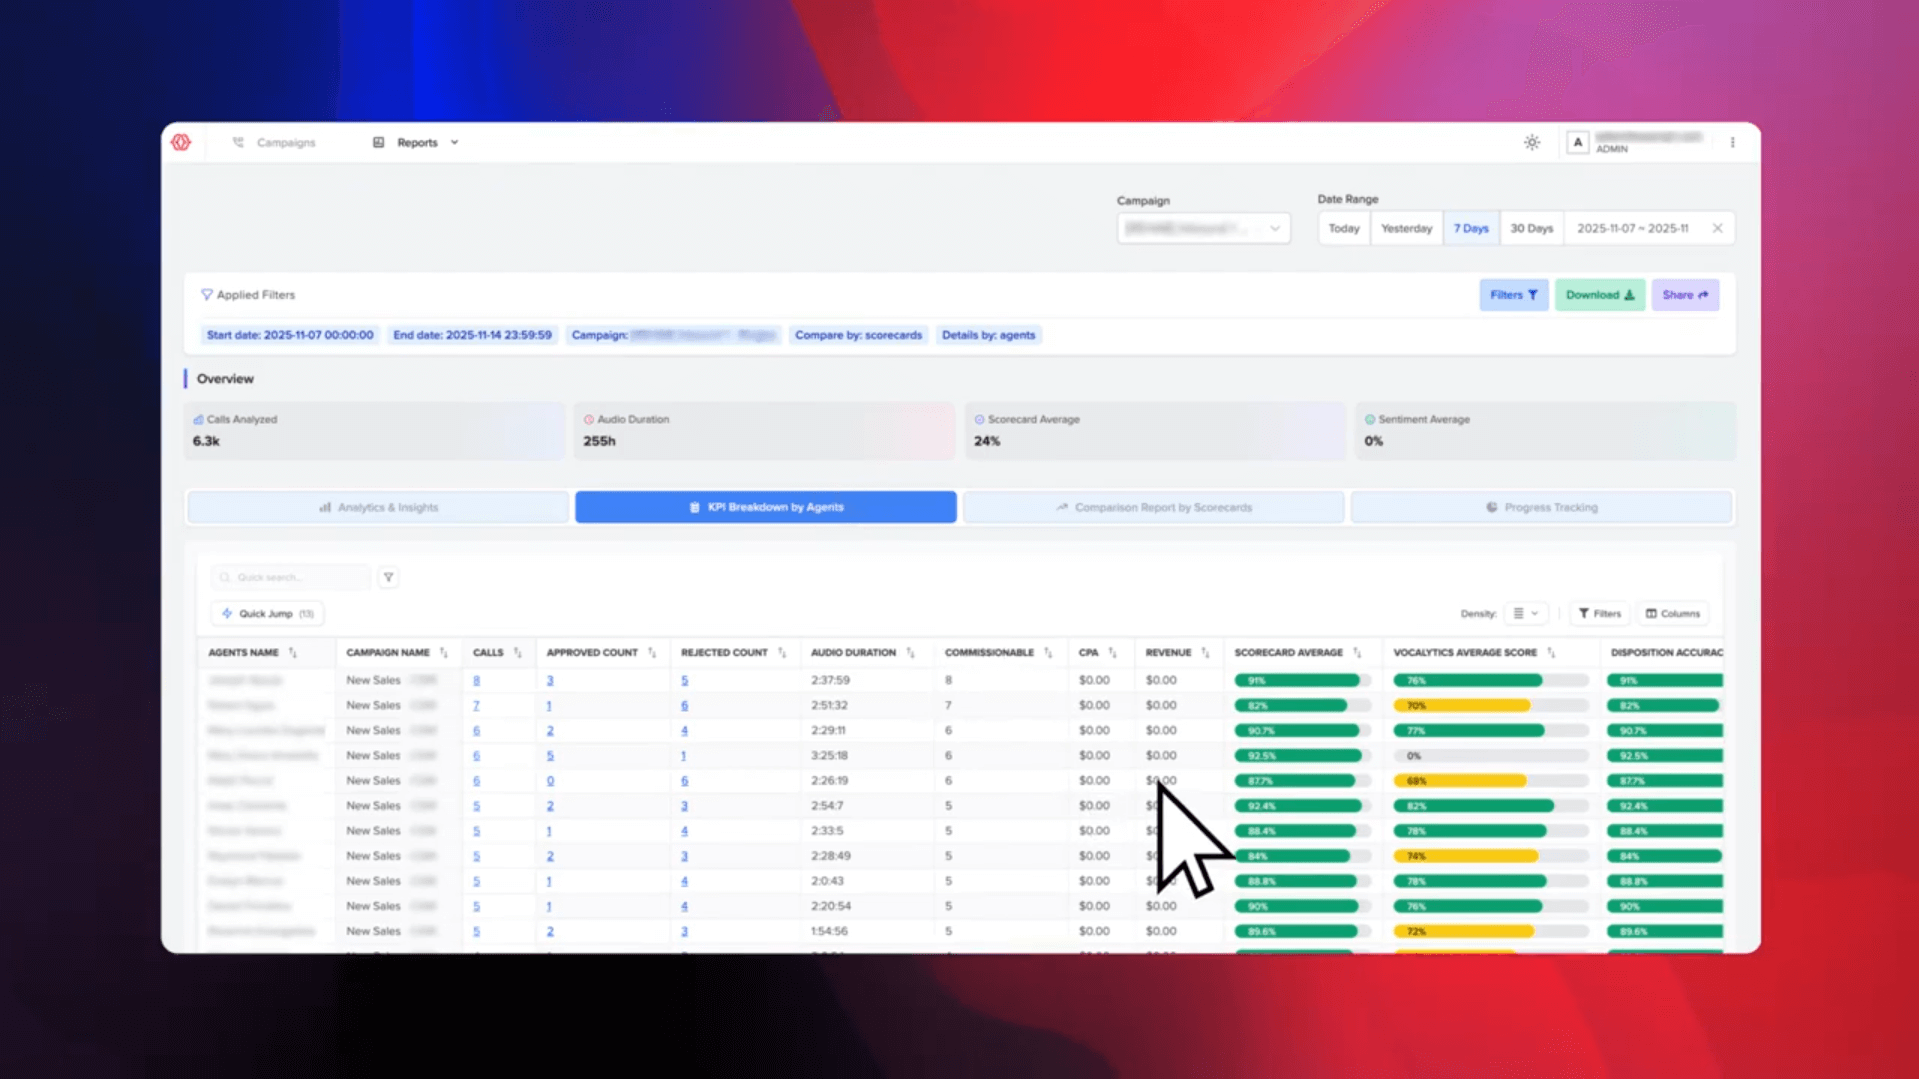
Insights, KPIs, and Scorecards
The dashboard includes multiple report sections, each offering a different perspective on performance. The Insights view provides a high-level overview by combining totals, averages, and success metrics across the selected data. The KPI view breaks those results down by the selected grouping, making it easy to identify top performers, underperformers, and trends. The Scorecard view summarizes overall performance across multiple metrics into a single score, simplifying comparisons across agents or teams.
Vocalytics & Disposition Accuracy
Reports go beyond surface-level metrics by incorporating AI-driven analysis. Vocalytics evaluates communication style and tone, including confidence, clarity, and empathy, providing deeper context into how calls sound—not just how they perform. Disposition Accuracy compares how agents marked call outcomes against AI classification, helping teams measure consistency and improve the accuracy of call tagging over time.
Sorting, Filtering, and Column Control
The Reports Dashboard is fully interactive, allowing you to sort columns to surface trends quickly and apply or remove filters in seconds. Columns can be toggled on or off to reduce noise and focus on the metrics that matter most. These controls make it easier to explore data efficiently while keeping reports clean and readable.
Presets and Downloads
Frequently used report configurations can be saved as presets, reducing repetitive setup and making it easy to return to common views. Reports can also be downloaded at any time, allowing teams to export data for offline analysis or sharing when needed.
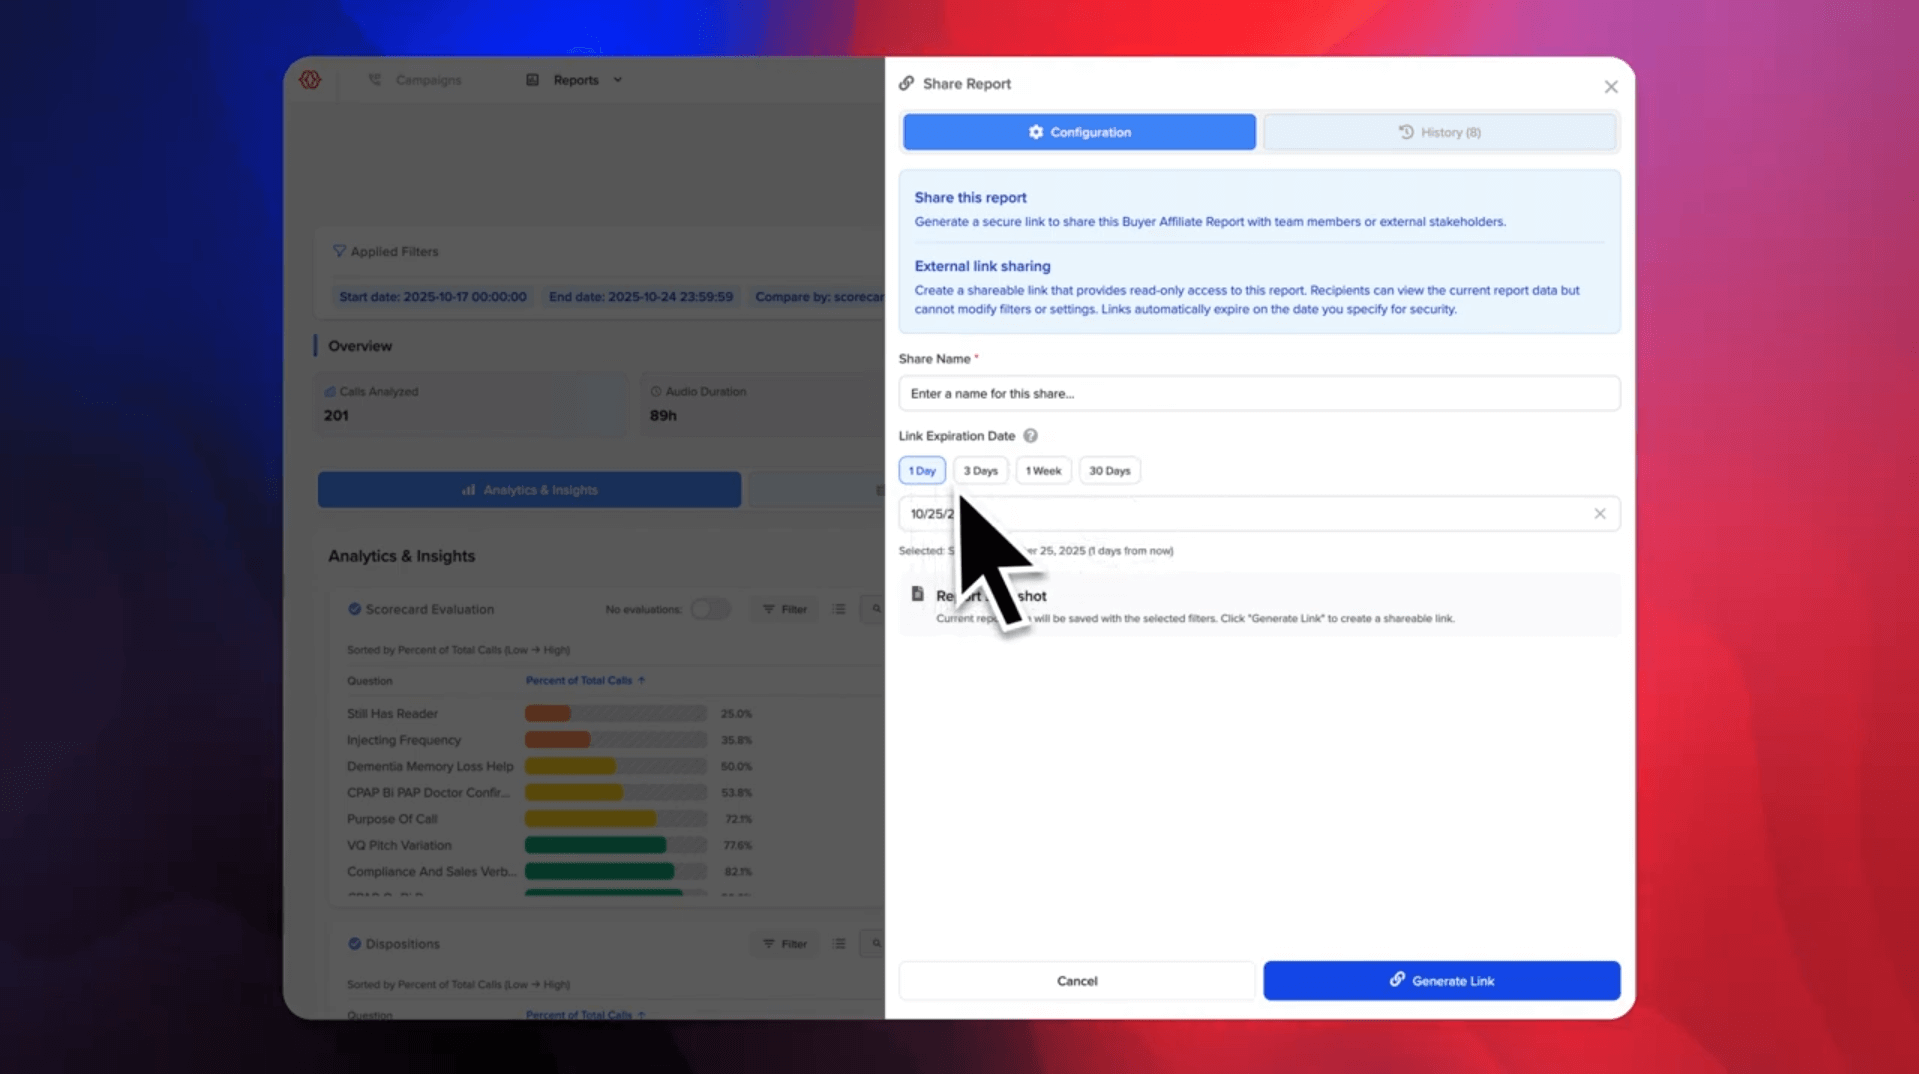
Shareable Links for Reports
Sharing reports is now faster and more effortless with Shareable Links. From the Reports Dashboard, you can generate a secure link for any report that preserves your selected filters, date range, groupings, and column configuration. Anyone opening the link sees the exact same report you're viewing, without needing to log in.
Links can be shared internally or externally and can be configured with an expiration for added security. This eliminates the need to export files or recreate reports and ensures everyone stays aligned on the same data and insights.
Get Started Today
These updates are available now to all OnScript users. To explore the new Reports Dashboard features, log into your account and navigate to the Reports section. If you have questions or need assistance setting up your reports, our support team is ready to help.